Item response theory
Item Response Theory (IRT)
Item response theory or IRT is one of the psychometric theories. It can be used
to evaluate the psychometric properties of an existing scale and its items, to optimally shorten the scale when necessary, and to evaluate the performance of the reduced scale. When used appropriately, IRT modeling can produce precise, valid, and relatively brief instruments resulting in minimal response burden.1)
IRT represents a family of mathematical models describing the probability with which examinees with different knowledge levels will provide an correct (or incorrect) answer to an assessment item, and is based on two postulates2):
The performance of an examine on an item can be predicted (or explained) by a set of factors called traits or latent traits, or abilities.
The relationship between examinees performance and the set of traits can be described by a monotonically increasing function called an item characteristic function or item characteristic curve (ICC).
Although principles of adapting the test to the examinee was recognized as a good practice in psychological measurement even from the middle of the 20th century (for example Carl Binet's, later Stanford-Binet IQ Test3)), it was an unscalable time-consuming task. But computers enabled implementation and automation of IRT procedures.
Item Characteristic Curve (ICC)
Every possible test item is described with its item characteristic curve (ICC) defined by the function P(θ). This function describes the probability that a subject with the knowledge level of θ will answer the given test item correctly. It is defined on the set of real numbers, but often plotted only on the interval of [-3,3]. There are various kinds of item characteristic curves, depending on how many parameters are included. Most commonly, one, two or three.
The One-Parameter Model
The one-parameter model, also called the Rasch model was introduced in 1960s by Georg Rasch.4) The equation describing the Rasch model is:
P(θ) is the probability of a correct response to an assessment item for the skill/knowledge level of θ
θ is the ability level
u=1 indicates that the student has given the correct answer to the item, and u=0 indicates an incorrect answer, and
b is the difficulty factor.
The Two-Parameter Mode
The two-parameter model or the logistic function, which was first used as a model to describe the item characteristic curve in the 1950s is defined as:
P(θ) is the probability of a correct response to an assessment item for the skill/knowledge level of θ
θ is the ability level
u=1 indicates that the student has given the correct answer to the item, and u=0 indicates an incorrect answer, and
a is the discrimination factor, describing how good the item can distinguish between subjects with different level of knowledge,
b is the difficulty factor.
The Three-Parameter Model
A component that accounts for the probability of guessing the correct answer was introduced into the two-parameter model in the 1968 by Birnbaum, thereby creating the three-parameter model described with the following formula:
Often, another extension in the formula is used5)6):

P(θ) is the probability of a correct response to an assessment item for the skill/knowledge level of θ
u=1 indicates that the student has given the correct answer to the item, and u=0 indicates an incorrect answer
D is a constant usually with value of 1.7,
a is the discrimination factor, describing how good the item can distinguish between subjects with different level of knowledge and usually having the value of the maximal slope of the ICC, theoretically any real number but usually limited to [-2.80,2.80],
b represents difficulty, theoretically also any real number value, but usually restricted to [-3,3] and
c is the guessing factor or pseudo-chance level, suggesting how likely is it to occur that a student without any knowledge will provide the correct answer to the item, theoretically ranging from [0,1], but in practice, values above 0.35 are not considered acceptable.

The item information function or just information function provides a measurement of the amount of information provided by an assessment item at a given ability level. The item information function is usually calculated as:
On the IIF graph, the location of the center of the IIF reflects the difficulty of the item, the height of the IIF reflects the item discrimination, and its asymmetry reflects the magnitude of the pseudo guessing parameter.7)
In the usual CAT approach, at any point of the assessment, the next item that will be presented is the one that will provide most information for the assessed ability level.8)
In CAT tests
the test takers do not have to take questions that are to complex or to simple for them
9)
Computer adaptive testing (CAT)
Computer adaptive testing or CAT refers to
… the redesign of psychological and educational tests for effective and efficient administration by interactive computers. Its objective is to select, for each examinee, the set of test questions that simultaneously most effectively and efficiently measure that person on the trait… The computer… determines how to begin the test for a given examinee, selects items based on the examinee's scored responses to previous items, and applies one or more rules to terminate an examinee’s test. 10)
IRT-based CAT algorithm
The development of IRT models provided a theoretical basis for principles and procedures of CAT and further their further improvements. A simple CAT algorithm runs as follows:11))
Unless known otherwise, the initial ability level θ is assumed to be in the middle of the scale; θ=0.
Define step size S, for example 3 (the larger the value, the sooner the loop coming next will finish).
Repeat
Based on the IIF select the item providing most information for the current level θ and present it to the examinee.
If the answer is correct θ=θ+S. Else θ=θ-S.
Until a correct and a false answer have been obtained at least once.
Repeat
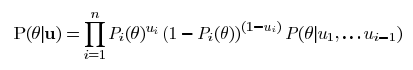
Estimate the a-posteriori probability distribution of the student’s knowledge using Bayes' rule
Estimate the knowledge level as the median of the calculated distribution
Item providing most information for estimated knowledge level (based in the IIF) is presented to the examinee and obtain an answer
Until a stopping rule is satisfied (for example: maximum number of presented items is reached, estimated knowledge distribution has small enough variance)


